The head-and-shoulders (H&S) chart pattern and its inverse version (IHS) are among the most reliable formations in technical analysis. If you trade stocks, cryptocurrencies, or forex, you will inevitably encounter these patterns. They signal a trend change: a bearish reversal for H&S, a bullish reversal for IHS.
The advantage of these patterns is that they provide clean entry points, clear stop-loss levels, and computable theoretical targets. No doubt, no ambiguity. That’s why they’re so popular among serious traders. This guide explains how to identify them precisely, trade them without headaches, and most importantly, how to avoid the false signals that cost money.
To navigate this article efficiently, here’s a summary of what you’ll learn:
| Section | What you’ll learn |
|---|---|
| Formation and structure | Visually identify an H&S or IHS, draw the neckline, understand proportions |
| Pattern psychology | Why distribution or accumulation drives a reversal |
| Confirmation and breakout | Differences between close break, wick break, and pullback behavior |
| Entry and exit | Entry points, stop-loss placement, and calculating the theoretical target |
| Statistics | Realistic success rates and cases to avoid |
Key takeaways
- Two-way reversal: H&S signals a bearish reversal after an uptrend, IHS signals a bullish reversal after a downtrend.
- Critical neckline: It’s the key to validation. It can be horizontal, rising, or falling. Its break triggers the signal.
- Harmony and proportions: The more symmetrical and well-proportioned the pattern, the more reliable it is. A forced or distorted pattern should be ignored.
- Volume and momentum: Volume should expand on the break. Weak volume makes the break less credible.
- Measured move: Projecting the head–neckline height from the break gives the primary target. It’s not guaranteed, but a statistical objective.
- Win rate: Studies show 60 to 75% validated breaks (depending on market and timeframe). Never bet everything on a single pattern.
What is a head-and-shoulders pattern
Reversal pattern: what the signal means
A head-and-shoulders (H&S) chart pattern is a trend-reversal formation. When it forms, it generally announces the end of an uptrend and the start of a downtrend. It’s a signal that says: "Warning: buyers no longer control the market."
The formation consists of three successive peaks: two lateral peaks (the shoulders) and a higher central peak (the head). Between these three points, price forms two troughs. An imaginary line connects these two troughs: that’s the neckline. When price breaks this neckline to the downside, the reversal signal is confirmed, and technical analysis suggests a decline should follow.
What makes this pattern so powerful is its clear, repeatable structure. Unlike other more abstract formations, H&S stands out unambiguously: three bumps, two troughs, a neckline. It’s visual, mechanical, and drawable.
The two versions: H&S and IHS
There are two main versions:
- Head and Shoulders (H&S): Forms after an uptrend and signals a reversal to the downside. The central peak (head) is higher than the two shoulders.
- Inverse Head and Shoulders (IHS): Forms after a downtrend and signals a reversal to the upside. The central trough (head) is lower than the two shoulders.
From a trading standpoint, both work on the same principle: identify the neckline, wait for the break, and place orders accordingly. The only difference is direction and the side you trade. An H&S pushes you to sell or short the market. An IHS invites you to buy or go long.
Which markets and timeframes the pattern appears on
Head-and-shoulders patterns appear across all markets: stocks, forex, crypto, commodities. No market escapes the psychology that creates this formation.
As for timeframes, you’ll encounter them on all of them: from 5-minute charts to monthly charts. However, the longer the pattern builds (4-hour, daily, weekly), the more reliable it becomes. An IHS formed over 3 months will carry more weight than one formed in 3 days.
A practical rule: on very small timeframes (1 to 5 minutes), patterns multiply but get noisier. False signals increase. If you’re starting out, prioritize 4-hour, daily, or weekly charts to study chart patterns.
How the head-and-shoulders pattern is built
H&S components: left shoulder, head, right shoulder
To understand it well, imagine the construction step by step:
Price rises, creates a peak (left shoulder), then pulls back forming a trough. Next, it rises again, but higher than the left shoulder: that’s the head. It drops again, carving a second trough. Finally, price rises a third time, but this time it does not exceed the height of the left shoulder or only barely: that’s the right shoulder. Price then declines, and that’s where the neckline becomes critical.
Each component plays a psychological role:
- The left shoulder shows confident buyers.
- The head shows a last-ditch attempt to gain ground, but it exhausts buyers.
- The right shoulder shows weakness: price can no longer return to the prior level. Sellers regain control.
The neckline: how to draw it correctly
The neckline connects the two troughs of the formation. It’s a straight, imaginary line that marks the psychological threshold. Its importance is not overstated: it validates or invalidates the entire pattern.
To draw it correctly, first identify the low of the left shoulder (first trough), then the low between the head and the right shoulder (second trough). Draw a straight line connecting these two points. Whether this line rises, falls, or stays flat changes the nature of the signal.
A common mistake: forcing a perfectly horizontal neckline. No. The line can have a slope. What matters is that the two troughs visibly define it, and that price then breaks it with force.
Horizontal, rising, or falling neckline: what changes
Horizontal neckline: The classic case. The two troughs are roughly at the same level. The break is very clear visually. The signal is straightforward.
Rising neckline: The second trough is higher than the first. This means the bearish shift is already underway. The break will occur faster, but it will be less of a "surprise" to the market. The subsequent move may be less violent.
Falling neckline: The second trough is lower than the first. It’s rarer. It shows progressive weakness. When the break happens, it can be particularly brutal as it releases built-up pressure.
In terms of tradability, the horizontal neckline remains the most common and the easiest to trade. The other variants work but require more experience to exploit well.
Practical validity rules (symmetry, duration, proportions)
For a pattern to be truly tradable, it should follow certain rules:
- Symmetry: The two shoulders should be roughly the same height. If the right shoulder is much lower or higher, it’s not a true pattern.
- Duration: The formation should take time. An H&S formed in 5 days is weaker than one formed in 3 weeks. The longer it takes, the more energy it accumulates.
- Proportions: The head must be meaningfully higher than the two shoulders. If all three peaks are almost at the same level, it’s not a reliable pattern.
- Volume: Volume should gradually contract as the pattern forms, then expand on the break of the neckline. Persistently low volume indicates a weak pattern.
If you spot a "pattern" that doesn’t respect these rules, leave it. There are hundreds of chart patterns and breaks per month. You don’t need to force a crooked setup.
The psychology behind H&S: a distribution phase
Why price fails to make a new high
During an uptrend, each new attempt to reach a higher high creates optimism. Buyers take control, price rises, all is well.
But at some point, buyers get exhausted. Prices have risen so much that there are no new buyers willing to step in. Early buyers and institutions who accumulated from the start begin to sell to lock in profits. This is the distribution phase.
At this stage, price still rises (that’s the left shoulder and the head), but with less conviction. Each high attracts more sellers. That’s why the right shoulder cannot exceed the head. The market is saturated with sellers. Supply outweighs demand.
This psychology is reflected in volume: it decreases as the pattern progresses. Demand was fading. When the break comes, it’s the logical outcome of this process.
What the two troughs and the neckline tell you
The two troughs are moments when buyers temporarily regain control. Each time, they test their ability to buy and push price higher. But each time, they fail to break above the previous high. That’s the essence of the reversal: buyers are no longer strong enough.
The neckline (which connects these two troughs) represents a support zone. It’s the floor where buyers stall the decline. As long as this line holds, there’s a chance the uptrend continues. But once it breaks, that support becomes resistance: sellers have control, and the down move accelerates.
Warning signs before the break (loss of momentum, repeated failures)
Before the neckline break, early signals warn attentive traders:
- Declining volume: At each new high, volume is lower. It’s a sign of exhaustion.
- Divergences on indicators: Price makes a new high, but RSI or MACD does not. That’s a bearish divergence.
- Shorter and weaker rallies: Each attempt to exceed the prior high lasts less time and travels less distance.
- Time stretching: As the pattern develops, each phase (right shoulder) takes longer. It builds uncertainty before the break.
A vigilant trader watching an H&S forming can already start reducing long exposure or preparing sell orders. No need to wait for the break to act: the signals come beforehand.
How to confirm a head-and-shoulders
Breaking the neckline: the validation signal
The break of the neckline is the decisive moment. That’s when theory becomes actionable trading. As long as price is above the neckline, the pattern remains dormant. A firm, definitive break wakes it up.
For a break to be truly valid, certain conditions should be met:
- Price must break the neckline clearly, not just barely poke through.
- The break should be accompanied by a notable increase in volume. No conviction, no break.
- The break should be confirmed by a candle close. A wick that pierces the line without a closing confirmation is less reliable.
Close break vs wick-only break: how to decide
Close break: The candle’s body crosses the neckline and the candle closes below it (for H&S). This is the strongest signal. Sellers controlled the entire candle.
Wick-only break: The candle’s wick pierces the neckline, but the body and the close remain above it. That’s weaker. It shows an attempt to break, but not a decisive win.
In practice, a close break yields higher success rates. If you see only a wick break, wait for confirmation with the next candle before triggering your entry. It reduces false signals.
Pullback to the neckline: when to wait and when to ignore
After a downside break of the neckline, price often rises back to retest this line before heading lower again. That’s the pullback. It’s normal and very common.
The pullback offers a second entry opportunity at a less aggressive price than the initial break. Many traders prefer entering on the initial break, while others wait for the pullback to avoid quick snapbacks.
When to ignore it? If price makes a pullback but doesn’t reach the neckline and volume diminishes, that’s a good sign. The down move is already underway. No need to wait for a pullback that may never come.
Conversely, if the neckline is tested a second time and volume collapses, that’s a warning sign. The pullback may turn into a bullish reload.
Pattern invalidation: when the setup is canceled
An H&S can be invalidated. It happens in these cases:
- Move back above the head: If after a break and pullback, price rallies and crosses above the head’s peak, the pattern is invalid. The reversal didn’t occur.
- Pullback that re-crosses the line: If the pullback clearly moves back above the neckline with rising volume, the break wasn’t valid.
- Macro announcement: A major news event (central bank decision, jobs report, etc.) can abruptly negate the pattern’s mechanics. The market changes direction regardless of the setup.
As a trader, accept that even the best patterns sometimes fail. A good risk/reward from the outset protects you in these cases.
How to trade H&S
Entry 1: enter on the neckline break
This is the aggressive approach. As soon as you see a definitive close below the neckline, you place a sell order (or short if using leverage).
Pros:
- You capture the beginning of the move, often the most violent.
- You’re positioned at the pattern’s exact reference point.
Cons:
- It’s noisier. Quick snapbacks and false signals are common.
- You can be stopped out quickly if the pullback is sharp.
This entry suits experienced traders who are adept at risk management and accept a few small losses to catch big moves.
Entry 2: enter after pullback with a confirmation candle
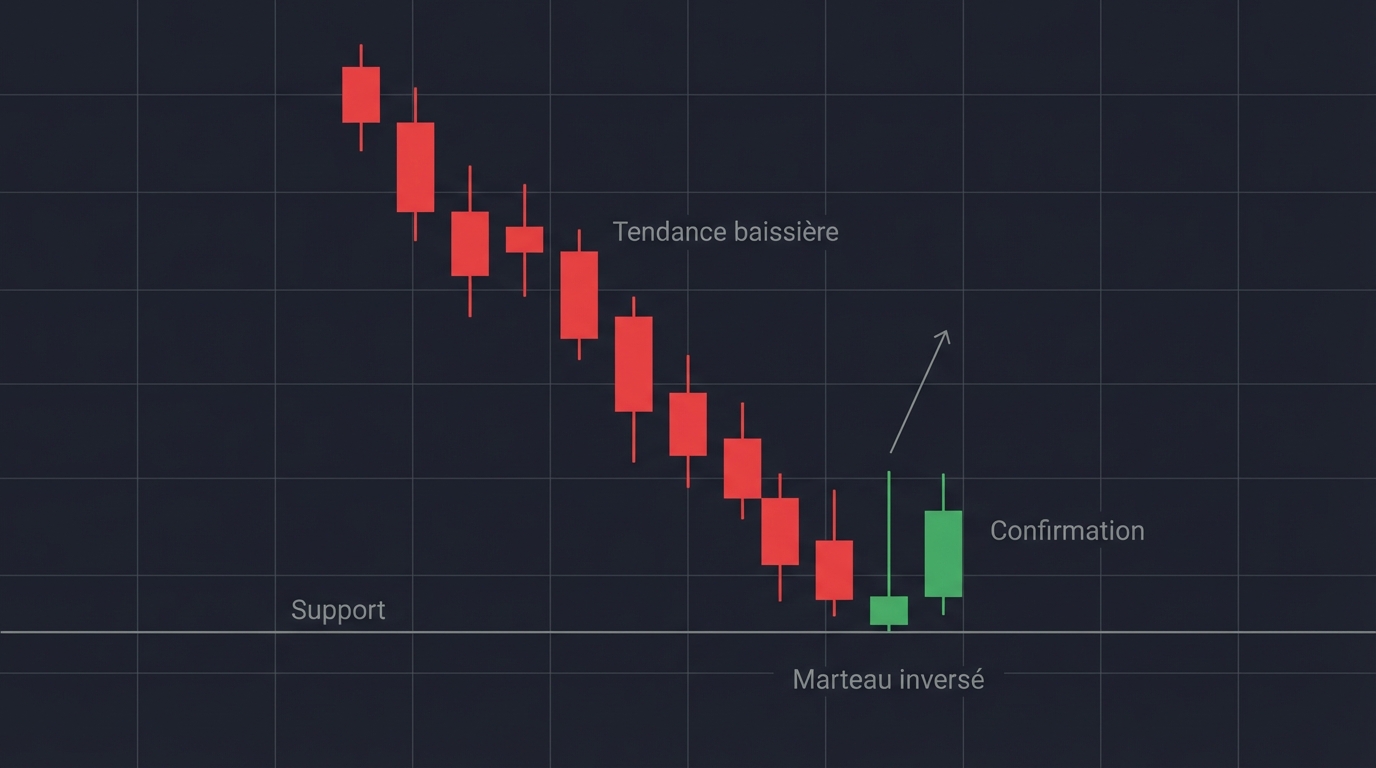
This is the conservative approach. You wait for price to break the neckline, then rise (pullback) to retest it. You enter only when you see a bearish confirmation candle: typically an inverted hammer, a bearish engulfing, or simply a close below the pullback level.
Pros:
- You filter out false signals. The pullback acts as a natural filter.
- Your entry is validated by two moves: the break and the confirmation.
Cons:
- You enter later, often at a less favorable price than the initial break.
- If the pullback is shallow and sharp, you miss part of the move.
This entry suits beginners and traders who prefer certainty over speed.
Stop-loss: logical placements based on structure
Your stop-loss should be placed where, if hit, it fully invalidates your thesis. For a short trade on H&S:
- Option 1: Above the right shoulder. Conservative. If price rallies to the right shoulder, the pattern failed.
- Option 2: Above the head’s peak. Wider. You tolerate a rally up to the head before accepting the loss.
- Option 3: 2 to 3% above the entry price (for traders who use a percentage rather than a specific chart level).
Placement depends on your profile: conservative or aggressive. A stop too tight causes premature exits. A stop too wide exposes you to large losses. Find the balance based on your account and risk tolerance.
Take profit: where to exit without guessing
Don’t exit blindly. Set a clear target before entering. Three approaches:
- Theoretical target: Project the head→neckline height from the break point. It’s mechanical and statistically robust.
- Next support: Look at the chart below the neckline. What’s the next major support? That’s a logical target.
- Trailing stop: Once the move is underway, trail the price with a stop a few percent behind. This lets you capture longer trends.
Most serious traders use a combination: sell 50% at the theoretical target, then let the rest run with a trailing stop. This builds a favorable risk/reward ratio.
Calculating the theoretical target of a head-and-shoulders
Main target: project the head → neckline height
This is the classic, most-used method. Here’s how:
Measure the vertical distance between the head’s peak and the neckline. Project that same distance downward from the point where price breaks the neckline. The resulting price is your primary target.
Concrete example: A stock trades at 100 EUR. The head hits 110 EUR. The neckline is at 95 EUR. Distance = 110 − 95 = 15 EUR. The break occurs at 95 EUR. Target = 95 − 15 = 80 EUR.
This method works remarkably well in practice. Statistics show that 60 to 70% of patterns reach this target within six months of the break. It’s not certainty, but a reliable probability.
Alternative target: project the shoulder → neckline height
If you’re more cautious and want an intermediate target, you can also project the shoulder→neckline height (without using the head).
It’s a more conservative target, often reached before the main target. It provides a good waypoint for trading the initial phase of the down move.
Limits of theoretical targets and price zones to respect
Theoretical targets are not guarantees. They’re statistical objectives. Here’s what to keep in mind:
- Price may stop well before the target if it encounters major support (prior lows, moving average, round number).
- Price may exceed the target if momentum accelerates.
- New economic data or a macro trend shift can invalidate the target.
- On small timeframes, targets are less reliable. On longer timeframes (daily, weekly), they are more compelling.
Use the theoretical target as a guide, not a physical law. Adapt your exit to the market context.
Example of a head-and-shoulders pattern
Worked example: drawing, break, pullback, target
Case study on the DAX (German index), daily chart, September 2023
The DAX was in an uptrend. On September 1, it hit a high at 16,500 points (left shoulder). It then fell and found a trough at 16,200 points on September 7. On September 10, it rallied and broke above the left shoulder, reaching 16,700 points (the head). Volume on this high was lower than on the left shoulder. Bad sign.
Price moved down. On September 15, it found a trough at 16,250 points (slightly lower than the first trough). This is where we draw the imaginary neckline: it connects the two troughs at 16,225 points, slightly rising.
On September 18, price rose a third time but only reached 16,400 points (the right shoulder). It did not exceed the left shoulder. Volume was very low. The H&S structure was set.
On September 22, price broke the neckline on the close by moving below 16,225 points. Volume exploded: 40% above average. That’s the confirmed break.
On September 25, a pullback: price rallied and touched 16,225 again without breaking back above. Volume dropped. It’s a weak pullback, a good sign for sellers.
Target calculation:
- Head = 16,700 points
- Neckline = 16,225 points
- Distance = 16,700 − 16,225 = 475 points
- Target = 16,225 − 475 = 15,750 points
Reality: the DAX fell to 15,780 points in October. The target was hit with remarkable precision (only 30 points difference).
What to note from the example (entry, stop, exit)
Entry: An attentive trader could have entered on the September 22 break around 16,200 points, or waited for the September 25 pullback and entered at 16,220 points.
Stop-loss: Logically placed above the right shoulder (16,400 points) or above the head (16,700 points). Risk on the position: 175 to 500 points depending on the choice.
Exit: Near 15,750 points at the main target. An aggressive trader might sell 50% at the first target and trail the rest. Profit achieved: 450 points (or 2.8% on the DAX).
Summary: a well-formed pattern, a clean break, a weak pullback, and a target reached. That’s a pattern that works.
The inverse head-and-shoulders: the bullish reversal
What is an inverse head and shoulders
The inverse head-and-shoulders (IHS) is the mirror image of H&S. Instead of three peaks with two troughs, you have three troughs with two interim peaks.
It appears after a downtrend and signals a reversal to the upside. It’s a powerful bullish signal. Buyers retake control after heavy selling.
The structure is as visual as H&S: a deep central trough (the inverted head), two higher troughs on each side (the inverted shoulders), and a neckline that connects the two interim peaks.
Forming an IHS: the three troughs and the neckline
Here is the step-by-step movement:
After a decline, price finds a trough (left inverted shoulder), then rises slightly to form an interim peak. It falls again and sets an even lower trough (the inverted head). It rises again, forming a second interim peak. Finally, it falls a third time, but not as low as the head: that’s the right inverted shoulder.
The neckline connects the two interim peaks. It’s a resistance line: as long as it holds, the downtrend can continue. But a break above this line signals buyers have regained control.
The progressively higher troughs show decreasing selling pressure: each trough is a bit higher than the previous one. It’s an accumulation of bullish strength.
The psychology of IHS: an accumulation phase
During a downtrend, sellers dominate. But gradually, the most patient buyers start accumulating at low prices. Each trough attracts buyers, but not yet enough to reverse the trend.
On each bounce (the interim peaks), panicked sellers sell again, creating resistance. But these sellers become fewer. Each subsequent trough doesn’t fall as much as the previous one because buyers step in to support price.
This is the IHS signature: quiet accumulation, a series of failed attempts to push lower. Buyers build a significant position quietly. When they finally strike, breaking the neckline to the upside, the explosive move that follows reflects the stored energy.
Confirming the IHS: neckline break and follow-through
As with H&S, confirmation comes with the neckline break. For IHS, it’s an upside break.
Validity criteria:
- The break should be clean and clear, not a light test.
- Volume should expand on the break, often dramatically.
- The close should remain above the neckline.
- After the break, price should not immediately fall back below the line (or only a very short throwback).
A throwback (the IHS equivalent of a pullback) can occur, but it’s often weaker than for H&S. If volume is strong on the break, the throwback is generally brief and shallow.
How to trade IHS
Entry: breaking the neckline resistance
Enter long as soon as a firm close occurs above the neckline with rising volume. It’s simple and straightforward: breaking resistance = bullish signal.
Two approaches:
- On the break: A buy stop just above the neckline to capture the beginning of the up move.
- After a throwback: If a short throwback forms, enter at the top of the throwback (as it turns back up). It’s safer, but you miss part of the start.
For IHS, entry on the break is less noisy than for H&S. Surging volume creates natural momentum. Many traders, including institutions, buy the break of an IHS without waiting for additional confirmation.
Stop-loss: below the right shoulder low or below secondary support
Your stop-loss should invalidate the bullish thesis. Two choices:
- Below the right inverted shoulder: Conservative. If price falls back below this level, the IHS structure failed.
- Below the central trough (the head): Wider. You tolerate a drop to the head before exiting.
Choose the first if you’re cautious, the second if you’re aggressive. A stop too tight will shake you out on noise. A stop too wide exposes you to a large loss.
Take profit: project head → neckline above the break
As with H&S, project the head→neckline height, but now upward from the break point.
Formula:
- Distance = neckline − head (lowest trough)
- Target = break + distance
Example: A stock trades at 40 EUR. The trough (inverted head) is at 35 EUR. The neckline (peaks) is at 38 EUR. Distance = 38 − 35 = 3 EUR. Break at 38.50 EUR. Target = 38.50 + 3 = 41.50 EUR.
This target is reliable. Combine it with another target (support/resistance, moving average) to refine your exit.
Volume: when expansion strengthens the signal’s credibility
Volume is the ultimate confirmer of an IHS. A neckline break with rising volume is about 70% more reliable than a break on low volume.
What to look for:
- Break volume should be 30 to 50% above the 20-day average.
- Volume on the throwback (if any) should be very low. That’s a good sign.
- Volume should remain elevated during the first days after the break. It confirms real bullish interest.
If you see a break on very low volume, it’s far less reliable. Wait for additional confirmation or move on to the next setup.
Identifying an inverse head-and-shoulders
Prior downtrend: the prerequisite
For an IHS to be valid, it should appear after a clear downtrend. No IHS in the middle of a sideways consolidation. You need bearish context first.
This downtrend can last 2 weeks, 2 months, or 2 years. The longer the decline, the more powerful the IHS that ends it will be.
Left shoulder, head, right shoulder: simple criteria to check
Here’s a visual checklist:
- First, a trough (left inverted shoulder).
- Then a bounce to an interim resistance.
- Then a drop creating a lower trough (head).
- Then a rise to a similar or slightly higher resistance.
- Finally, a last drop creating a higher trough than the head (right shoulder).
- Then a final bounce.
If you spot this structure, you likely have an IHS. It’s visual and mechanical.
Main support line and secondary support line
Two lines matter in an IHS:
- Neckline: Connects the two interim peaks (the highs between the three troughs). This is the true neckline.
- Secondary support line: Connects the lows of the left and right shoulders. It usually crosses the neckline. It acts as an intermediate support.
Drawing these two lines correctly is crucial for identifying the pattern and placing your orders.
Neckline: how to validate that it’s relevant
For a neckline to be relevant in an IHS:
- It must connect two clear, visible peaks, not two insignificant blips.
- These two peaks must appear after the three troughs of the formation, not before.
- The neckline can slope horizontally, upward, or downward. All are valid.
- The two peaks should be roughly at the same level, within a 1 to 3% variance.
Ignore a neckline that doesn’t meet these criteria. It’s a common trap.
Steps to spot an IHS on a chart
Step-by-step procedure:
- Confirm you’re in a downtrend for at least 2 weeks.
- Identify the lowest trough: that’s the inverted head.
- Identify the two troughs on each side: those are the inverted shoulders.
- Check that the right shoulder is higher than the head (the central trough must be the lowest).
- Draw the neckline by connecting the two interim peaks that follow each trough.
- Wait for an upside break of this neckline.
- Check volume on the break: increase ≥ 30%.
- You have a confirmed IHS. Ready to trade.
This method eliminates 90% of false signals.
Head and Shoulders: differences between H&S and IHS
Differences in context (prior trend) and signal direction
H&S: Appears after an uptrend. Signals a bearish reversal. You sell or short.
IHS: Appears after a downtrend. Signals a bullish reversal. You buy.
It’s a complete inversion. But the mechanisms are identical. It’s just a mirror and direction change.
Differences in reading the neckline (support vs resistance)
H&S: The neckline acts as support. As long as it holds, the uptrend can continue. A downside break (loss of support) signals the breakdown.
IHS: The neckline acts as resistance. As long as it holds, the downtrend can continue. An upside break (resistance breach) signals the reversal.
The psychology is the same—just inverted.
Pullback vs throwback: common behaviors after the break
Pullback (for H&S): After a downside break, price rallies to retest the neckline. This occurs about 60% of the time. The pullback usually lasts 2 to 5 days and remains shallow (less than 50% of the break).
Throwback (for IHS): After an upside break, price dips to retest the neckline. It’s also common, but generally weaker than H&S pullbacks. A throwback that retraces more than 50% of the break is a warning sign.
IHS typically has stronger post-break bullish momentum. That’s why throwbacks are less pronounced.
Head and Shoulders: what are the risks when trading this pattern
Balanced, harmonious pattern: key reliability criterion
Not all H&S or IHS patterns are tradable. Only the harmonious and well-proportioned ones are.
A "lopsided" pattern (one shoulder much lower than the other, a spiky head, totally uneven time intervals) has much higher failure rates.
Harmony criteria:
- The two shoulders within ±5% of each other’s height.
- Similar time intervals between the three peaks/troughs (e.g., 10 days, then 10 days, then 10 days).
- The head clearly more extreme (higher for H&S, lower for IHS).
- Volume gradually contracting until the break.
If a pattern meets only about 50% of these criteria, skip it. There are hundreds of patterns per year. No need to force it.
The longer the build, the more tradable it becomes
An H&S formed over 3 weeks will have a 55 to 60% success rate.
An H&S formed over 3 months will have a 70 to 75% success rate.
An H&S formed over 6 months will have a success rate above 75%.
The reason is simple: the longer the formation, the more participants it gathers (institutions, retail traders, algorithms). The mechanics become inevitable. Small timeframes (1 to 4 hours) produce many patterns, but they are noisy. Longer timeframes (daily, weekly) produce fewer, but more reliable ones.
If you’re starting out, target daily or higher timeframes. Give patterns at least 2 months to form properly before trading them.
When to avoid trading the pattern (neutral trend, forced pattern, incoherent context)
Avoid trading H&S or IHS in these cases:
- Neutral or sideways trend: A pattern that forms in consolidation without a clear prior trend is a trap. False signals spike.
- Forced pattern: You spot barely 70% of the criteria and force yourself to see a pattern. No. Look for a real one.
- Incoherent macro context: A central bank announces a rate hike right before the H&S break. The market may ignore the pattern and rally anyway.
- Illiquidity: On small-cap stocks or small cryptos with low volume, patterns are easy to manipulate. Trade only liquid assets.
- Extreme news flow: Before a major election, court decision, or major earnings announcement, avoid trading patterns. Unpredictability increases.
Discipline means saying "no" to 80% of the patterns you spot. Only the best 10 to 20% deserve your capital.
Statistics and probabilities of pattern success
Break follow-through rates: what the stats show
Academic research and professional trading data show:
- H&S on daily charts: 65 to 72% valid breaks (i.e., price continues lower after the break).
- H&S on 4H charts: 58 to 65%.
- H&S on 1H charts: 52 to 60%.
- IHS: Slightly higher rates than H&S (2 to 5% higher) because post-break bullish momentum is stronger.
These percentages mean that in at least 35% of cases, the break is invalid or becomes a trap. A trader who trades all patterns without filtering will lose regularly.
Probability of reaching the target: what to infer
Among the 65% valid breaks:
- About 85 to 90% reach the theoretical target (or a target between 80 and 120% of it).
- About 50% exceed the theoretical target.
Practical inference: if you enter on the break with a logical stop-loss and a take-profit at the theoretical target, your average win rate will be 55 to 65% (65% valid breaks × 85% target hits = 55%). That’s amply sufficient for profitability, provided your risk/reward is favorable.
For example: risk 100 EUR on 10 patterns, make 400 EUR on the 6 winners, lose 400 EUR on the 4 losers. Result: breakeven. Not glamorous, but realistic.
Frequency of pullbacks/throwbacks: impact on strategy
The data show:
- Pullbacks (H&S): Occur in 60 to 70% of valid breaks. They retest the neckline without reversing it (80% of the time).
- Throwbacks (IHS): Occur in 50 to 60% of valid breaks. Less common and milder than pullbacks.
Strategic impact: if you wait for a pullback to enter an H&S, you’ll get it about 60% of the time. If you don’t see it, don’t wait: the market has decided.
For IHS, throwbacks are less frequent. A lack of throwback doesn’t invalidate the pattern. Enter on the break without waiting.
Conclusion
Head-and-shoulders patterns (H&S and IHS) are among the most reliable chart formations for trading trend reversals. They offer clear structures, clean entry points, and computable targets.
Summary addressing your search intent:
To trade inverse head-and-shoulders (IHS) patterns, you should:
- Identify the prior downtrend and the three progressively higher troughs.
- Draw the neckline by connecting the two peaks that form resistance.
- Wait for a clear upside break with rising volume (30%+ above average).
- Enter on the break or after a short throwback with strong-volume confirmation.
- Place a stop-loss below the right shoulder or below the central trough depending on your risk tolerance.
- Set the target by projecting the head→neckline height above the break point.
- Diversify across several patterns rather than betting on a single one (success rate: 60 to 75%).
Success with this approach depends mainly on your discipline: choose good patterns, ignore forced ones, and accept that some breaks will fail. No pattern is 100% certain. The real skill is identifying harmonious formations, managing risk intelligently, and remaining consistent over the long run. Trade on proper timeframes (daily or higher), allow enough time for the pattern to form correctly, and never force a setup you only see with 70% certainty.