The Evening Star is one of the most powerful Japanese candlestick patterns for identifying a bearish reversal. If you follow technical analysis, you’ve likely heard of this chart pattern. And for good reason: it appears regularly across all markets—stocks, crypto, indices, forex—and can signal the arrival of an imminent downtrend.
But beware: knowing the definition of the Evening Star isn’t enough to profit from it. You must understand why the pattern works, when not to take it, and especially how to integrate it into disciplined risk management. That’s what we’ll break down together in this guide.
Here’s a preview of the key points you’ll discover:
| Section | Key content |
|---|---|
| Pattern definition | Structure of the 3 candles and bearish logic |
| Validity conditions | Uptrend, resistance, candle quality |
| Visual identification | How to spot the Evening Star on a chart |
| Entry strategies | 3 methods to trade the Evening Star prudently |
| Risk management | Stop loss, take profit, and sizing |
| Variations and traps | Doji star, abandoned baby, false signals |
Key takeaways
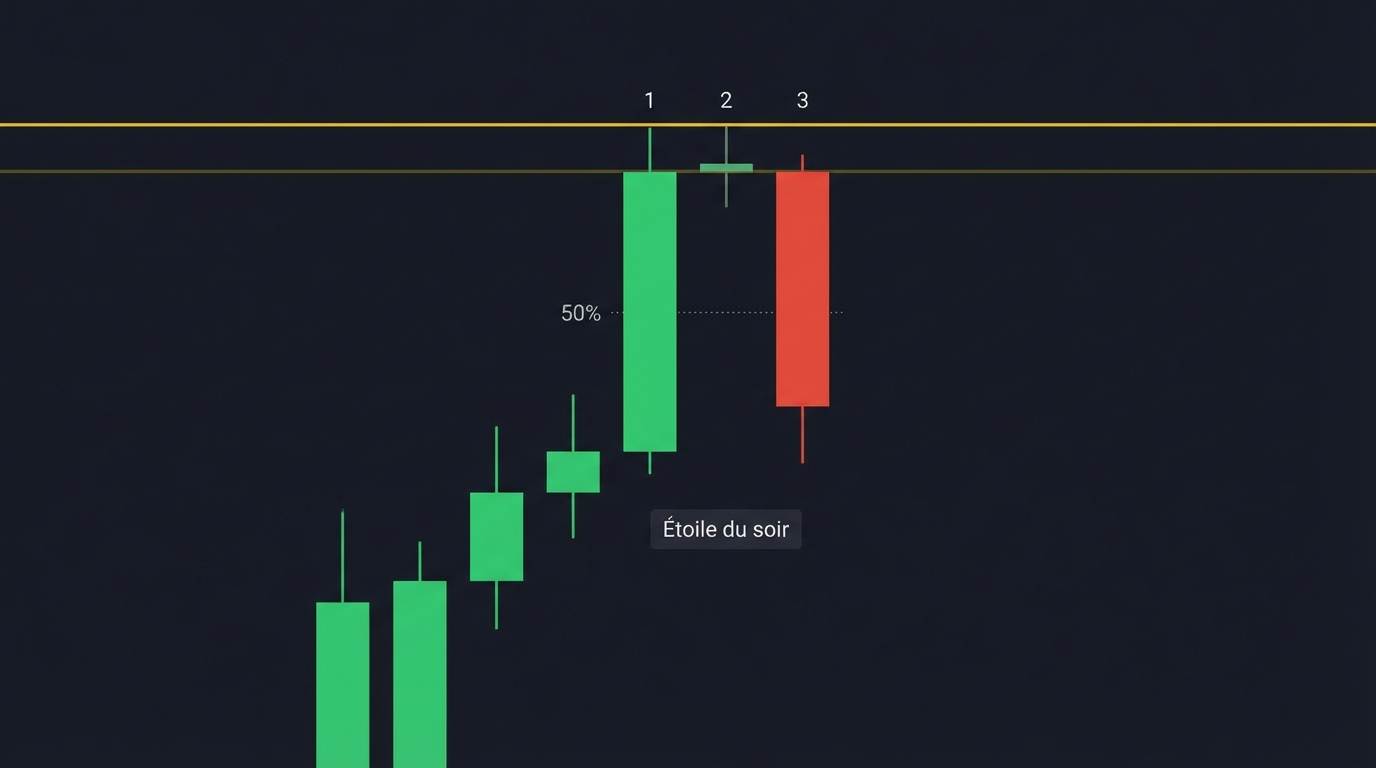
- The Evening Star is a bearish reversal made up of 3 candles: a bullish candle, a hesitation candle (small body), then a bearish candle
- This chart pattern only works in a clearly identified uptrend
- The quality of the third candle (its close and range) determines the reliability of the signal
- Price context (resistance, overextension) drastically increases your odds of profitability
- Risk management matters more than the pattern itself: always define your stop loss before entering
- There are several variations (doji, abandoned baby) that slightly change the pattern’s interpretation
Key facts to know before using it
What the pattern indicates (market psychology)
The Evening Star tells a story: an uptrend that is gradually losing strength. During the first bullish candle, buyers control the market. Prices rise with conviction.
Then comes the second candle—the hesitation candle. Sellers step in and create doubt. Price pulls back, the body becomes small. The market wonders: are we going to keep rising or flip lower?
Finally, the third candle answers the question. This is where the bearish trend takes over. Sellers push the close significantly lower. And you, as a trader, observe this shift in momentum. It’s the moment when collective psychology flips: buyers step back, sellers attack.
When the signal is most reliable (trend + zone)
All chart patterns work better within a clear context. For the Evening Star, that context is: a confirmed uptrend + a credible reversal zone.
You can spot the uptrend by drawing a line through your successive lows: are they each higher than the last? You’re in an uptrend. If not, ignore the signal.
The reversal zone can be: a horizontal resistance (a price where the market has stalled several times), a psychological level (round numbers like 100, 1000), or an overextended move (price has rallied 20%, 30% without a pullback).
Evening Star + trend + zone? You’re looking at a legitimate trading setup.
What invalidates the signal (false starts)
The Evening Star isn’t a guarantee. It can be a false signal. Here’s what invalidates the pattern:
- An immediate bullish rebound: if price rallies back above the Evening Star’s high before the downtrend confirms, the signal is canceled.
- No bearish follow-through: the Evening Star should be followed by at least one lower close; otherwise it’s just noise.
- A range-bound market (no clear trend): if you spot an Evening Star while price is oscillating sideways, you’re taking unnecessary risk.
- Extremely low liquidity: especially on some altcoins, a pattern can form and then be broken by a single large buy order.
What is the Evening Star in Japanese candlesticks?
Pattern definition (bearish reversal)
The Evening Star is a chart pattern composed of three consecutive candles. It’s a bearish reversal pattern, which means it occurs after an uptrend and generally signals a forthcoming downtrend.
This Japanese candlestick pattern forms only after a significant price rise. It can’t appear just anywhere on the chart. That condition is what makes it reliable: it tells you the market has rallied, and now it’s changing its mind.
Unlike other chart patterns that can be complex, the Evening Star is simple to recognize once you understand its 3 candles.
The 3 candles that make up the pattern
First candle (bullish and strong): A long bullish candle showing buyers are in control. The body of this first candle should be solid, without hesitation. Think of a strong upward impulse.
Second candle (hesitation): This is the heart of the pattern. The second candle has a small body (bullish or bearish, it doesn’t matter). It opens in continuity with the first candle (or with a small gap), but it doesn’t close beyond the first candle’s open. Price rises, then retreats. It’s the market displaying indecision.
Third candle (bearish and strong): Here, sellers take control. The third candle closes significantly lower. Its range should be sufficient to show real bearish conviction.
Strict vs flexible rule (3rd candle closing level)
There are two ways to interpret the Evening Star’s validity, depending on how strict you want to be.
The strict rule requires the third candle to close below the midpoint of the first candle’s body. This is the classic definition from traditional Japanese candlesticks. It’s very selective: it rejects many signals, but those it accepts are higher quality.
The flexible rule only demands a significant close on the third candle without specifying an exact threshold. It’s more flexible but increases false signals. You’ll capture more trades but with a lower win rate.
As a prudent trader, I recommend the strict rule to start. Fewer trades, but more confidence in your setups.
What does an Evening Star look like?
Candle 1: bullish impulse (long body)
The first candle should be unquestionably bullish. Look at its structure: the body (distance between open and close) should be long and decisive. The lower wick can be very short or nearly nonexistent. The upper wick should be minimal.
This first candle represents a day (or an hour, depending on your timeframe) where price rose strongly. Buyers dominated from start to finish.
Candle 2: hesitation (small body, spinning top or doji)
The second candle is completely different in character. Its body becomes small. It can be a doji (open and close roughly the same), a spinning top (small body with long wicks), or simply a small-bodied bullish or bearish candle.
What matters is that this second candle shows doubt. Price pushes above the first candle (or meets it), but doesn’t hold. It falls back. Sellers step in.
Candle 3: bearish flip (long body)
The third candle is the verdict. It’s bearish and solid. Its body should be long enough to show the downtrend is truly beginning. It closes significantly below its open.
Ideally, it closes below the midpoint of the first candle (strict rule). It can even push through the second candle’s low.
Visual guides to plot (pattern high, midpoint of candle 1)
To clearly identify the Evening Star on your chart, draw two mental (or actual) lines using your platform tools:
- The pattern high: generally the high of the second candle. A move back above this level would invalidate the signal.
- The midpoint of the first candle’s body: the threshold you watch to check whether the third candle truly closes below it (strict rule).
These guides help you qualify the pattern visually and make more objective decisions.
Essential conditions to validate the pattern
Identify a true uptrend before the signal
This is foundational. You can’t trade an Evening Star without a clear prior uptrend. How do you identify it?
By structure: draw a line through successive swing lows. Are they rising? Then draw a line through highs. Are they rising too? If yes, you have an uptrend.
By moving averages (optional): a short-term moving average (e.g., 20-period) above a longer-term average (50 or 200) confirms the uptrend. But it’s not mandatory; structure comes first.
Without this prior trend, an Evening Star is just chart noise. This is your first check before even looking at the 3 candles.
Look for a credible reversal zone
The Evening Star works best when it appears at a meaningful place on the chart. The most reliable zones:
A horizontal resistance: a price level where the market has stalled multiple times. If your Evening Star forms exactly at this level, the signal is amplified. Sellers know there’s a psychological barrier above.
A psychological level: round numbers (100, 1000, 50000 for Bitcoin, etc.) act like magnets. Traders set targets around these levels. An Evening Star at 50000 on Bitcoin carries more weight than one at 49500.
An overextended move: if price has rallied for a long time without a pullback (15%, 20%, 30%), the Evening Star may appear right when excess volatility “needs to reset.” It’s ideal timing for a reversal.
Without one of these zones, you’re in no-man’s-land. Your stop loss will be fuzzy, your risks uncertain.
Check the quality of candle 3
The third candle is your confidence barometer. The stronger it is, the better your reason to act. Check:
- Its close: does it close significantly below its open? Is there genuine bearish conviction?
- Its range: compared to the first two candles, is it similar in size or larger? A very small third candle dilutes the signal.
- Its wicks: does it have a long lower wick (rejection), or does it close near its low (conviction)? A close near the low shows stronger bearish conviction.
If the third candle is weak, hesitate. Wait for additional confirmation before opening a position.
The role of volume by market (stocks, indices, crypto, forex)
Volume adds a layer of confirmation. Unfortunately, it’s not available across all markets.
On stocks and indices: check that the third candle comes with high volume. It’s proof sellers were motivated.
On crypto: volume exists (on reputable venues) and broadly follows the same logic as stocks.
On forex: there’s no centralized volume in the traditional sense. Rely on candle structure and context alone.
Bottom line: if you have access to volume, use it to validate. If not, don’t insist—the Evening Star’s structure is enough.
Variations of the Evening Star to know
Doji Evening Star
When the second candle is a doji (open and close nearly identical, with wicks), we call it a Doji Evening Star. This doji strengthens the idea of indecision.
Why? Because a doji shows the market failing to establish a direction. Buyers and sellers are evenly matched. It’s even more powerful than a simple small bullish or bearish body.
The Doji Evening Star is often considered more reliable than the standard Evening Star. It appears less often, but when it does, take it seriously.
Abandoned baby
The abandoned baby is a rare, extreme variation of the Evening Star. Here, the second candle isn’t just small—it’s gapped from the other two candles.
First candle bullish, then a gap up, second candle doji, then a gap down, third candle bearish. It’s visually striking and shows a true shift in order flow.
But this pattern is rare on certain markets (notably forex, where overnight gaps are common but this exact configuration is not). On stocks and crypto, it’s easier to spot and very powerful when it forms.
Evening Star vs Shooting Star (don’t confuse them)
The Shooting Star is a single-candle pattern: a small body with a long upper wick. It can appear after an uptrend and signal a rejection of higher prices.
The Evening Star has 3 candles. They’re different patterns. The Shooting Star is less robust; the Evening Star brings more confirmation.
Don’t confuse them. A standalone Shooting Star? Less reliable. A complete Evening Star? Far more compelling.
Evening Star vs bearish engulfing / dark cloud cover
The bearish engulfing pattern is where the second candle fully engulfs the first. It’s powerful, but different from the Evening Star.
Dark cloud cover is a pattern where the second (bearish) candle penetrates the first (bullish) candle but doesn’t engulf it entirely. It’s a kind of half-engulfing.
All of these are bearish reversals, but their structure and probabilities vary. The Evening Star’s hallmark is indecision on the second candle, not engulfment.
Evening Star vs Morning Star (bullish version)
The Morning Star is the exact opposite of the Evening Star. It appears after a downtrend and signals a bullish reversal. Its 3 candles: strong bearish, small (indecision), then strong bullish.
In this guide we focus on the Evening Star (bearish reversal). The Morning Star follows the same principles in reverse. Master one, and the other comes naturally.
How to identify an Evening Star on a chart
Quick 7-point checklist
Before acting on an Evening Star, run through this checklist:
- ✓ Clearly established uptrend before the pattern? (Higher highs and higher lows)
- ✓ First candle long and bullish? (Long body, decisive)
- ✓ Second candle with a small body? (Doji, spinning top, or small bullish/bearish body)
- ✓ Third candle long and bearish? (Long body, low close)
- ✓ Third candle closes below the midpoint of the first? (Strict rule)
- ✓ A resistance zone or overextended bullish context? (Pattern not isolated)
- ✓ Volume present on the third candle? (If available on your market)
7/7? You have a true setup. 6/7? Valid, but less optimal. Fewer than 6? Wait for a better opportunity.
Most common reading mistakes
Range-bound market: you spot an Evening Star, but price is moving sideways. No uptrend. It’s a trap. Reversal patterns only work in established trends.
Second candle too “big”: if the second candle has a long, clear body, it’s not really an Evening Star. It’s more like an engulfing or a simple reversal. Indecision is defined by a small body.
Third candle too weak or without a convincing close: a third candle that closes near its open, or with a large body but a long lower wick (partial rejection), dilutes the signal. You’re seeing hesitation, not true bearish conviction.
Signal taken in the middle of nowhere: the Evening Star forms without any nearby resistance or structural zone. It’s an isolated signal. Avoid it. The best trades form at meaningful levels.
Validation via market structure
Beyond the 3 candles, look at what happens before and after.
Break of short-term support: if the third candle breaks below a local support (a recent swing low), that’s extra confirmation the reversal is underway.
Polarity flip: a prior high (a level the market couldn’t break) now acts as resistance. That’s evidence the trend is changing.
Market structure enriches your read. Don’t rely solely on the 3 candles.
Confirmation with indicators (optional, to test)
Indicators can validate your Evening Star, but they’re not required. Test these if you want an extra layer:
Moving averages: if price approaches a declining moving average (e.g., 50 SMA), it confirms bullish momentum is fading.
RSI (Relative Strength Index): an RSI above 70 indicates overbought conditions. If your Evening Star appears here, the signal strengthens. A bearish divergence (higher price but lower RSI) reinforces it further.
MACD: if the MACD loses momentum (histogram bars shrink) as the Evening Star forms, it suggests the uptrend is weakening.
Bollinger Bands: if price tagged the upper band and pulls back, and your Evening Star forms there, it’s a context of rejection at elevated prices.
Again: these indicators help, but don’t decide. Structure remains the priority.
How to trade the Evening Star
Method 1: entry at the close of candle 3 (aggressive)
This is the most direct way to trade the Evening Star. As soon as the third candle closes, you sell (or short, depending on your market and style).
Minimum conditions: you’ve validated the 7-point checklist. The Evening Star is solid, the zone is relevant, the third candle closes with conviction.
Pros: you enter quickly. You don’t miss the start of the bearish move. You capture most of the trend.
Risks: the market can snap back immediately in the next minutes or hours. You can get stopped quickly. That’s why this method is “aggressive.”
Method 2: entry on a break of candle 3’s low (conservative)
You wait for price to break below the third candle’s low to confirm the bearish move.
Trigger: one or two candles after the Evening Star, price drops below candle 3’s low. That’s your entry signal.
False-signal filter: if price rallies above the Evening Star’s high before breaking the low, ignore the signal. It’s invalidated.
Pros: you get extra confirmation. You filter out some false signals. Your win rate rises.
Cons: you enter later. You miss part of the initial move.
Method 3: entry on a pullback after the breakdown (patient)
This is the patient trader’s strategy. Price breaks below candle 3’s low, then pulls back slightly. You enter on the retest.
Possible retest zones: price may retest the second candle’s low, or even the third candle’s high. That’s your retest area.
Price action trigger: a small bearish candle (or a doji) forms at the retest, followed by a bearish close. That’s your entry signal.
Pros: better risk/reward. Your stop loss will be close to your entry. You have two confirmations (the breakdown + the pullback).
Cons: price may keep rising without a pullback. You miss the trade.
Stop loss, take profit, and risk management
Where to place the stop loss (3 logical spots)
Above the pattern high: the widest placement. If price rallies above the second candle’s high, your bearish thesis is invalid. Exit.
Above candle 2 only: if structure is very clear (strong resistance just above, or an obvious bearish context), you can tighten your stop above the second candle. It’s tighter, riskier, but more efficient.
Volatility-based stop (ATR): if the market is noisy and shifting, use ATR (Average True Range). Place your stop one ATR above the pattern high. This adapts risk to current volatility.
Choose the placement that matches your profile. Aggressive traders accept wider stops. Conservative traders tighten them.
Where to place take profit (3 approaches)
Prior supports and lows: look left on the chart. What important supports lie below? An old swing low, a horizontal zone? Use these levels as your first target.
Risk/reward targets: define your risk first (distance between entry and stop). Then set take profit at 1.5x, 2x, or 3x that risk. For example: you risk €100, you aim to gain €200 or €300.
Partial exit + trailing stop: don’t take all profit at once. Sell 50% at the first target, then trail the stop on the remaining half to let the downtrend run.
These three approaches can be combined. A prior support becomes your first target (50%), then you use a risk multiple for the second (remaining 50%).
Position sizing
Fixed risk per trade: decide on a maximum amount you accept to lose per trade. For example: €100, 1% of your account, or 2% for more aggressive traders.
Then calculate position size so that risk is respected. If you risk €100 and your stop is 50 pips away, compute how many contracts (or shares) align with that risk.
Avoid overexposure (correlations): if you trade multiple Evening Stars at the same time (on Bitcoin, Ethereum, Apple, etc.), ensure your total risk remains reasonable. Unexpected correlations across markets can amplify losses.
Invalidation and false signals: when not to trade
Typical invalidation scenarios
Immediate bullish rebound: the third candle closes, but the next candle already rallies strongly. This indicates sellers lack conviction. Skip this signal.
No bearish follow-through: the 2–3 candles after the Evening Star are bullish or flat. Price clings to the pattern high. That’s a sign the bearish move isn’t real.
Bullish breakout above the pattern high: your stop loss is hit. Do not stay in the trade. The Evening Star is formally invalidated. Exit.
Risky markets and periods
Macroeconomic announcements: before jobs data, central bank decisions, or earnings, volatility can spike. Your Evening Star can be whipsawed by news. Avoid trading the 30 minutes before these events.
Extreme volatility: on certain days (crashes, unfounded rallies, unexpected market halts), candles can be huge and unrepresentative. Your patterns get distorted.
Low liquidity: on altcoins or thinly traded stocks, a small order can move price disproportionately. Your Evening Star may not be as solid as it looks.
How to spot the Evening Star with TradingView
Understand the tool’s trend detection
TradingView offers a screener or alerts for the Evening Star. But you need to understand its settings to use it well.
SMA50 option: the tool detects the Evening Star only if price is above its 50-period moving average. It’s a simple way to confirm an uptrend.
SMA50 and SMA200 option: the tool requires price to be above the 50 SMA AND the 50 SMA to be above the 200 SMA. It’s stricter and more reliable.
No trend detection option: the tool accepts the Evening Star anywhere. It’s very aggressive and produces many false signals.
Set the filter to your style (scalping, swing, long-term)
Scalping (minutes to hours): use SMA50 only. You’re fast and can’t wait for a confirmed SMA200.
Swing trading (hours to days): use SMA50 + SMA200. It’s a good balance. You filter out short-term noise while capturing solid reversals.
Long-term (days to weeks): use SMA50 + SMA200 on daily or weekly timeframes. An Evening Star on the weekly chart carries far more weight than one on the hourly.
Best practices to scan without over-optimizing
TradingView can scan every candle across all markets. It’s tempting—but risky.
Define your universe first: which markets interest you? The 20 CAC 40 stocks? Major cryptos? Scan only those.
Combine the scanner with your visual analysis: don’t blindly follow alerts. Open the chart, verify the resistance zone and market structure. The scanner assists; it doesn’t decide.
Review history: use bar replay or scroll back to see where patterns would have triggered. This gives you insight into their real-world hit rate.
Worked examples to replicate
Example 1: pattern at resistance (the “textbook” setup)
Imagine Bitcoin in August 2021. Price has climbed from €30,000 to €50,000 without a pullback. It reaches an old resistance at €50,000. Right there, an Evening Star forms.
First candle: bullish, long body. Second candle: small doji. Third candle: bearish, closing below the midpoint of the first.
Textbook. The Evening Star occurs at a clear psychological and structural level. It’s preceded by a strong uptrend. Sellers step in exactly where they should.
In the days that follow, Bitcoin drops to €40,000. Those who sold at the close of the third candle (or on the break of candle 3’s low) captured that move.
Example 2: pattern in a range (setup to avoid)
Ethereum oscillates between €1,500 and €1,700 for 3 weeks. No clear trend. An Evening Star forms.
You think to yourself: “It looks like an Evening Star; I’ll sell.” Bad idea. There’s no uptrend to reverse. It’s a range-bound, indecisive market.
Indeed, price initially dips to €1,650, but quickly rebounds to €1,680. You’re stopped out for a small loss. The Evening Star was a false signal because it lacked context.
Example 3: pattern + pullback (patient entry)
Apple rallied from August to October 2024 (fictitious example). An Evening Star forms in October. You don’t enter immediately—you wait for confirmation.
Price breaks below the third candle’s low. Bingo, you have the breakdown. Then price rises slightly and retests the second candle’s low. A bearish candle forms at the test. That’s your entry signal.
You sell there. Your risk is from entry to a stop above the pattern high. Your risk is tight. Price then drops 5%. You have a solid R multiple.
Example 4: Doji Evening Star vs classic Evening Star
Tesla rallies strongly. At a top, a classic Evening Star forms: bullish candle, small bearish candle, bearish candle.
A week later, Nvidia shows the same configuration, but its second candle is a doji (open and close nearly identical).
Visually, Nvidia’s Doji Evening Star is more powerful. It shows total indecision. The Tesla signal is solid, but Nvidia’s is rarer and more reliable.
If you had to choose one to risk your capital on, the doji gives more confidence.
Advantages and limitations of the Evening Star
Strengths of the pattern
The Evening Star has proven itself across all markets—stocks, crypto, indices, commodities. It’s a universal pattern recognized by traders for centuries (Japanese candlesticks date back to 18th-century Japan).
It’s easy to spot visually once you’ve seen it a few times. No complex calculations, no maze of indicators. The 3 candles speak for themselves.
It appears regularly. You don’t have to wait years to see it. With a few months of active trading, you’ll identify several instances.
Structural limitations (probability, context, timing)
The Evening Star is not a guarantee of profit. Even a textbook setup can fail. Why? Because markets are probabilistic, not deterministic.
An Evening Star at resistance, in a clear trend, with a strong third candle, might have around a 60% chance of producing a bearish move. That’s better than random, but far from 100%.
Volatility changes. News breaks. Correlations shift. Your perfect signal can be overwhelmed by a Fed announcement. That’s market reality.
How to improve the win rate without overcomplicating
Be selective about zones: only accept an Evening Star if it forms at resistance, a psychological level, or after an overextended move. Avoid isolated signals.
Ask for confirmation: wait for price to break below the third candle’s low before acting. You’ll eliminate many false signals at this step.
Check market structure: before the Evening Star, is the uptrend truly clear? Draw a line through swing lows. Are they rising? If not, move on.
Start smaller: trade a smaller size with your first Evening Stars to learn. Scale up gradually as your experience grows and your hit rate proves out.
FAQ about the Evening Star
Does the Evening Star work on all timeframes?
Yes and no. The pattern is valid on all timeframes—1 minute, 5 minutes, 1 hour, 1 day, 1 week. But the longer the timeframe, the stronger the signal.
An Evening Star on the daily chart carries far more weight than one on the hourly. Why? Because it represents 3 full days of trading (3 daily candles), not just 3 hours.
Longer-term traders (swing, position) should prioritize daily or weekly Evening Stars. Scalpers can use it intraday, but with lower expectations for reliability.
Do you absolutely need a gap on candle 2?
No. A gap strengthens the pattern, but it’s not mandatory. The second candle can simply open at, or slightly above, the first candle’s close.
What matters is that the second candle has a small body and reflects indecision. If there’s a gap, great. If not, that’s fine.
Can you trade the pattern without indicators?
Absolutely. Japanese candlesticks are self-sufficient. The structure of the 3 candles speaks for itself. You don’t need any technical indicators.
If you use one (RSI, MACD, moving averages), it’s for extra confirmation, not as a requirement. Many experienced traders rely only on candles and market structure.
Which stop loss is the most robust for this pattern?
The most robust is the stop above the pattern high (generally the second candle’s high). It’s the logical placement: if price moves back above that level, the Evening Star is invalid and your thesis is wrong.
It also tends to give you the highest long-term win rate, even if the stop is wider than other choices.
What’s the difference between a Doji Evening Star and an Abandoned Baby?
Doji Evening Star: the second candle is a doji (open ≈ close), with wicks. Gaps between candles are optional.
Abandoned baby: it’s an Evening Star where gaps are mandatory. The second candle (a doji) gaps up from the first and then gaps down into the third. It’s a very specific configuration.
The abandoned baby is rarer but more powerful. The Doji Evening Star is more common. Both are reliable bearish reversals.
Conclusion
The Evening Star is one of the most accessible and reliable chart patterns in technical analysis. Composed of 3 distinct Japanese candlesticks, it signals a shift in market psychology: from buyer dominance to seller control.
But like any trading tool, its effectiveness depends on context. An isolated Evening Star, far from any resistance, in a range-bound market? That’s a false signal. The same pattern formed at a clear reversal zone, after a true uptrend? That’s a solid setup.
Your success rests on three simple principles: seek an established uptrend, wait for a credible reversal zone, and verify the quality of the 3 candles. Then manage your risk rigorously. Set your stop loss before entering. Size your position so you can accept the loss without panic.
The Evening Star is not a “golden goose.” No pattern is. But it’s a powerful tool to identify likely bearish reversals. Use it with humility, rigor, and discipline, and you’ll build a durable, profitable trading approach.