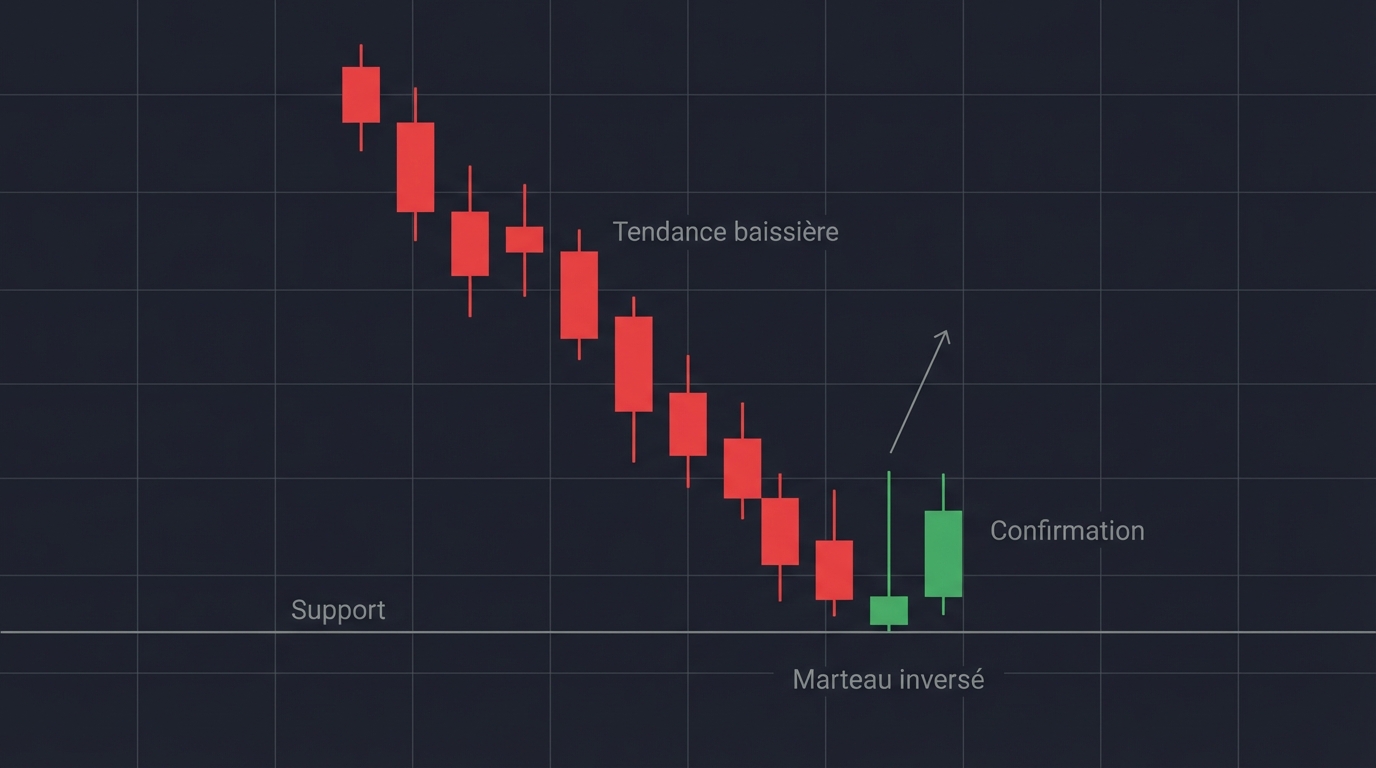
The inverted hammer is one of the most useful Japanese candlestick patterns for identifying bearish trend reversals. If you’ve ever seen a candle with a long upper wick and a tiny body, you’ve likely spotted an inverted hammer. This pattern reveals something important: after a decline, buyers tried to take back the market, but sellers pushed them back. It’s a signal that the downtrend is starting to show signs of fatigue.
This article explains how to recognize the inverted hammer on a chart, understand what’s really happening behind the pattern, and above all, how to use it in a solid trading strategy suited to your real money. You’ll also discover when this signal works and when you should ignore it.
Here’s a quick summary of what you’ll learn:
| Section | What you will understand |
|---|---|
| Understanding the inverted hammer | Pattern definition, market psychology, and conditions that make it relevant |
| Identifying the signal on a chart | Exact visual criteria, proportions to check, and pattern variants |
| Validating the context | Prior trend, price zones, and optional indicators to use |
| Confirmation and invalidation | How to know if the signal is reliable and when to abandon it |
| Trading the pattern | Three entry methods, risk management, and position sizing |
| Examples and checklist | Real-world cases to replicate and mistakes to avoid |
Key takeaways
- The inverted hammer is a bullish candle with a long upper wick, a small body, and almost no lower wick
- It signals that buyers pushed back sellers after a decline, but not enough to close high
- This pattern has value only in a bearish or weakening trend context
- You must wait for confirmation (the next candle) before acting with real money
- Price location (support, Fibonacci, psychological level) strengthens the signal
- Three entry methods exist: on a break of the high, at the confirmation close, or on a pullback
- Stop loss and take profit should follow price rules, not random numbers
- The inverted hammer works across markets (stocks, crypto, forex) and all timeframes
Understanding the inverted hammer
Definition and role of the pattern
The inverted hammer is a Japanese candlestick that appears after a bearish phase. Visually, it consists of a very small body (the difference between open and close) and a very long upper wick that extends well beyond the body. The lower wick is almost nonexistent or extremely short.
Imagine this: during a bearish period, the market opens at a certain price. Sellers continue their work, price goes down. But suddenly, buyers arrive in force and push the price very high. However, before the candle closes, sellers regain control and push the price back down. The result? A candle with a long upper wick (buyers’ attack) and a small body (price returning lower).
This pattern matters because it reveals a shift in dynamics. During the downtrend, sellers dominated without challenge. With the inverted hammer, buyers show they exist and have money to spend. It’s the first sign the trend may reverse.
Market psychology behind the long upper wick
When you see a long upper wick on an inverted hammer, it represents a real battle between buyers and sellers. Buyers pushed price very high, testing whether sellers would give way. But they didn’t fully: price closed low.
Why does this matter? Because it shows the downtrend is starting to tire. Sellers have been selling for a long time, prices have fallen, and at some point, there aren’t many left willing to sell. So when buyers show up, they can lift price quickly. The long upper wick illustrates exactly that moment.
The price falling back (the small body) simply means sellers still retain some short-term control. But the sudden appearance of strong buyers is the real signal. It’s like seeing the first signs of a counterattack in a battle.
Market conditions where the signal is relevant
The inverted hammer is not useful everywhere. It works really well in two situations:
After a clear downtrend. If price has dropped over several candles, weeks, or months, and an inverted hammer appears, that’s a strong signal. The pattern says “the drop has gone on long enough—look, buyers are coming back.”
At key price zones. If the inverted hammer appears at support (an area where price has bounced several times before) or at a psychological level (like 10,000 or 50,000), the signal is much more reliable. It’s as if the market is testing that zone to see if it will hold.
In these two contexts, the inverted hammer becomes a truly useful candle. Without a prior downtrend, it’s just a candle with a special shape—nothing more.
When the inverted hammer has no value
Ignore the inverted hammer in these situations:
When it appears in the middle of a strong uptrend. If the market has been rising for several candles and an inverted hammer shows up, buyers are already in control. It’s not an imminent reversal; it’s just a small bullish pause.
When it forms in a range (sideways trading). If price has been moving up and down between two levels for a while, the inverted hammer has no special reliability. Avoid trading it.
With no structure around it. If you see an inverted hammer that appears without support, resistance, or Fibonacci confluence, it’s a weak signal. Leave it aside.
Identifying an inverted hammer on a chart
Essential visual criteria
To recognize a true inverted hammer, focus on these three elements:
A very long upper wick. This is the defining trait. The upper wick must be at least two to three times the length of the body. If the upper wick is barely longer than the body, it’s not an inverted hammer.
A small or tiny body. The open and close should be very close to each other. If the gap is wide, you’re likely looking at a different candle.
An almost invisible lower wick. There may be a tiny lower wick, but it must be very short. If the inverted hammer has a lower wick as long as the upper wick, it’s not the right pattern.
Together, these three criteria create a distinctive silhouette: a small body with a very long “hair” sticking up. That’s what makes the inverted hammer easy to identify once you know what to look for.
Proportions to check (body, upper wick, lower wick)
Be precise with proportions. Here are ideal measures:
The upper wick should be at least 2 to 3 times the body length. If it’s exactly 1.5 times, the signal is weak. If it’s 5 to 10 times, even better (it shows a real buyer battle).
The body should be small: ideally, less than 15–20% of the candle’s total height. A body that’s 40% or more is not a classic inverted hammer.
The lower wick should be less than 20% of the body length, or nearly nonexistent. If it’s long, you’re looking at a different pattern (like a doji).
These proportions help you filter quickly. If you see a candle where the upper wick isn’t clearly dominant, move on.
Candle color: what really matters
The color of the inverted hammer matters, but less than you might think.
A green (bullish) inverted hammer signals that the close is above the open. It’s more bullish, but not mandatory for the pattern.
A red (bearish) inverted hammer signals that the close is below the open. Technically, that dilutes the bullish signal, but the pattern can still work if the context is good.
In reality, what matters most is the position of the close relative to the open. A green inverted hammer is more reliable than a red one, but both can signal a reversal if confirmation follows.
Never dismiss a red inverted hammer if everything else (trend, support, confirmation) is present. The pattern’s psychology (sudden appearance of buyers after a decline) is more important than the exact color.
Pattern variants (doji inverted hammer, tolerated lower wick)
Sometimes you’ll see variations of the classic inverted hammer:
The doji inverted hammer. When the open and close are exactly at the same level with a very long upper wick, it’s a doji inverted hammer. This candle shows a perfect balance between buyers and sellers. It’s a very reliable signal, often even more than the classic inverted hammer.
The inverted hammer with a small lower wick. If the lower wick is slightly longer than zero but still very short, that’s fine. As long as the upper wick is clearly dominant, the pattern remains valid. Don’t be too rigid: markets aren’t mathematical.
The inverted hammer with hollow or filled body. Whether the body is hollow (open below, close above) or filled (open above, close below) doesn’t change the pattern. It’s just the candle’s color.
The important thing is the overall structure: a long upper wick, a small body, a tiny lower wick. Light variations don’t break the model.
Context to validate before acting
Required prior trend (decline, trend fatigue)
Here’s the golden rule: an inverted hammer without a prior downtrend is a weak signal. Always.
Before trading an inverted hammer, look for a bearish phase. How long? It depends on the timeframe. On a 1H chart, a few bearish candles are enough. On a daily chart, you want to see at least 2–3 weeks of decline. On a weekly chart, a month or more.
The drop doesn’t need to be vertical or extreme. Even a slow, steady decline counts. The idea is that sellers have done their work, prices have fallen, and buyers start to emerge with the inverted hammer.
You can also trade an inverted hammer when an uptrend is very tired. If price rose, then consolidated sideways and begins to show signs of weakness, the inverted hammer can signal the consolidation is ending… but to the upside.
Without this prior trend, ignore the inverted hammer regardless of its shape. That’s the difference between a signal that works 60–70% of the time and one that works 20% of the time.
Price zones to prioritize
Horizontal support
An inverted hammer that appears exactly at horizontal support (an area where price rebounded 2–3 times before) is extremely reliable. This support represents a zone where buyers have already shown interest.
If the inverted hammer tests this support with its lower wick, even better. That shows price hit support, then buyers immediately counterattacked (hence the long upper wick). It’s a very bullish scenario.
Note exactly where this support lies on your chart. If the inverted hammer deviates by more than 5–10%, move on.
Psychological level
Psychological levels (10,000; 50,000; 100 for a stock, etc.) attract many traders. When an inverted hammer appears at these levels, buyers and sellers are testing market psychology.
An inverted hammer at the 50,000 mark on Bitcoin is more reliable than one at 49,850. Round numbers truly matter in real trading, even if that’s psychological.
Mark these levels on your chart before trading. It’s free validation of the signal.
Trendline and channel
If you’ve drawn a bearish trendline or a downward channel, and the inverted hammer appears right at the lower channel, that’s confluence. The pattern becomes more reliable.
An inverted hammer above the lower trendline of a descending channel sends a clear signal: sellers can no longer hold that line; buyers are testing it.
Draw your trendlines before looking for the inverted hammer. Don’t do it afterward—that’s cheating.
Confluence with Fibonacci
Fibonacci levels (retracement or extension) can also confirm an inverted hammer. If price dropped sharply, then rebounds to a Fibonacci level (often 38.2% or 50%), and the inverted hammer appears exactly there, it’s extra confluence.
You don’t need Fibonacci to trade the inverted hammer. But if it’s there, it’s one more reason to trust the signal.
Volatility, liquidity, and market hours
Volatility affects the inverted hammer’s reliability. In a very volatile market with large gaps between candles, the inverted hammer is less reliable. Price moves too fast for the pattern to be meaningful.
In a market with normal or low volatility, the inverted hammer is more predictable. Wait for reasonable volatility before using it to trade real money.
Liquidity matters too. If you trade an illiquid asset (low volume, wide spreads), the inverted hammer can be a mirage. The true market price may differ greatly from what you see.
Prefer major, liquid assets: CAC 40, Eurostoxx, major forex pairs (EUR/USD), large cryptos (Bitcoin, Ethereum). On these assets, liquidity is real, and the inverted hammer works better.
Market hours matter. An inverted hammer in the middle of the European or U.S. session is more reliable than one during off-hours (night in Europe, for example, when only Asia is trading).
Volume: how to use it by asset
The volume on the candle where the inverted hammer appears gives you clues:
An inverted hammer with normal or slightly elevated volume shows buyers really acted. That’s better than an inverted hammer with very low volume.
On stocks and cryptos, where volume is readily available, look for volume above the 10–20-candle average. It indicates genuine interest.
On Forex, volume is harder to interpret (data is less comprehensive). Don’t overthink volume in Forex. Rely on context and price structure.
Never reject an inverted hammer just because volume is low. If trend, support, and confirmation are present, the signal remains valid. Volume helps, but it’s a nice-to-have, not a must-have.
Confirmation and invalidation of the signal
Confirmation by the next candle
Close above the inverted hammer
The simplest confirmation: the candle following the inverted hammer should close above the body of the inverted hammer. Ideally, it should close near its high.
Why? Because it shows buyers have taken control. The inverted hammer revealed their arrival; the next candle confirms they remain in charge.
If the next candle is green (close > open) and closes well above the inverted hammer, that’s the ideal confirmation. You can act with confidence.
Break of the candle’s high
A more aggressive confirmation is a break above the high of the inverted hammer’s upper wick. When the next candle exceeds the inverted hammer’s high, it means buyers aren’t stopping at the close—they’re continuing the move.
It’s even more reliable than a simple close above. But it requires you to wait a bit longer, so price may have already moved up before you enter.
Choose between these two confirmations based on your style: faster (close above) or safer (break of the high).
Clear invalidation
Break of the low
If the next candle breaks the inverted hammer’s low, the signal is invalidated. It means sellers have regained control, contrary to what the pattern suggested.
When the low is broken, buyers were just an illusion. Sellers still dominate. The inverted hammer failed.
If you have an open trade when the low is broken, close it. That’s the simple, iron rule.
Immediate rejection below resistance
Sometimes, the inverted hammer sends a bullish signal, the next candle rises, but it immediately hits resistance and falls back.
If two or three candles after the inverted hammer, price is clearly rejected below a resistance, the signal weakens. Buyers don’t have enough strength to break that resistance. Close the trade or skip it.
Confirmation by market structure
Break of micro-resistance
After an inverted hammer, look for a small local resistance (e.g., the previous candle’s high). If the next candle breaks this micro-resistance, that’s extra confirmation.
This break shows the move is organized and structured, not just a random buyer attempt.
Sequence change (higher low)
Watch the lows since the beginning of the decline. Before the inverted hammer, lows were making lower lows (steady downtrend). After the inverted hammer, if lows start to print higher, that’s a sequence change.
A higher low is a very powerful confirmation. It means the bearish structure is broken.
This change may take 2–3 candles to become clear, but it’s a top-tier confirmation.
Indicator filters (optional)
Moving averages (trend and momentum regain)
A simple 20- or 50-period moving average can help you filter. If price is above its moving average and the inverted hammer appears, it’s a good context. If the inverted hammer appears well below the average, invalidation can be faster.
After the inverted hammer, see if price returns to its moving average. If it does and breaks above it, that’s a confirmed momentum regain.
Don’t make moving averages mandatory. They help, that’s all.
RSI (divergence, oversold exit)
The RSI (Relative Strength Index) can serve as a filter. If RSI is oversold (below 30) just before the inverted hammer, the signal is more reliable. Oversold shows the decline is overextended.
A bullish divergence (price makes a lower low while RSI makes a higher low) alongside the inverted hammer is a very powerful filter. It means bearish strength is weakening.
After the inverted hammer, if RSI climbs back above 50, that’s confirmation that momentum is shifting.
MACD (momentum returning)
The MACD (Moving Average Convergence Divergence) can show a momentum change. If the MACD line crosses above its signal line shortly before or after the inverted hammer, that’s confirmation of bullish momentum returning.
It’s not mandatory, but it’s a welcome plus—especially on higher timeframes (4H, daily).
Bollinger Bands (excess and reentry)
Bollinger Bands display price volatility. An inverted hammer that touches or exceeds the lower Bollinger Band shows an excess of decline. That’s an ideal context for a reversal.
After the inverted hammer, if price reenters between the two bands, it signals the extreme volatility is over and a new trend is forming.
Bollinger Bands are truly optional. Use them if they help you grasp volatility; otherwise, ignore them.
Inverted hammer vs. similar patterns
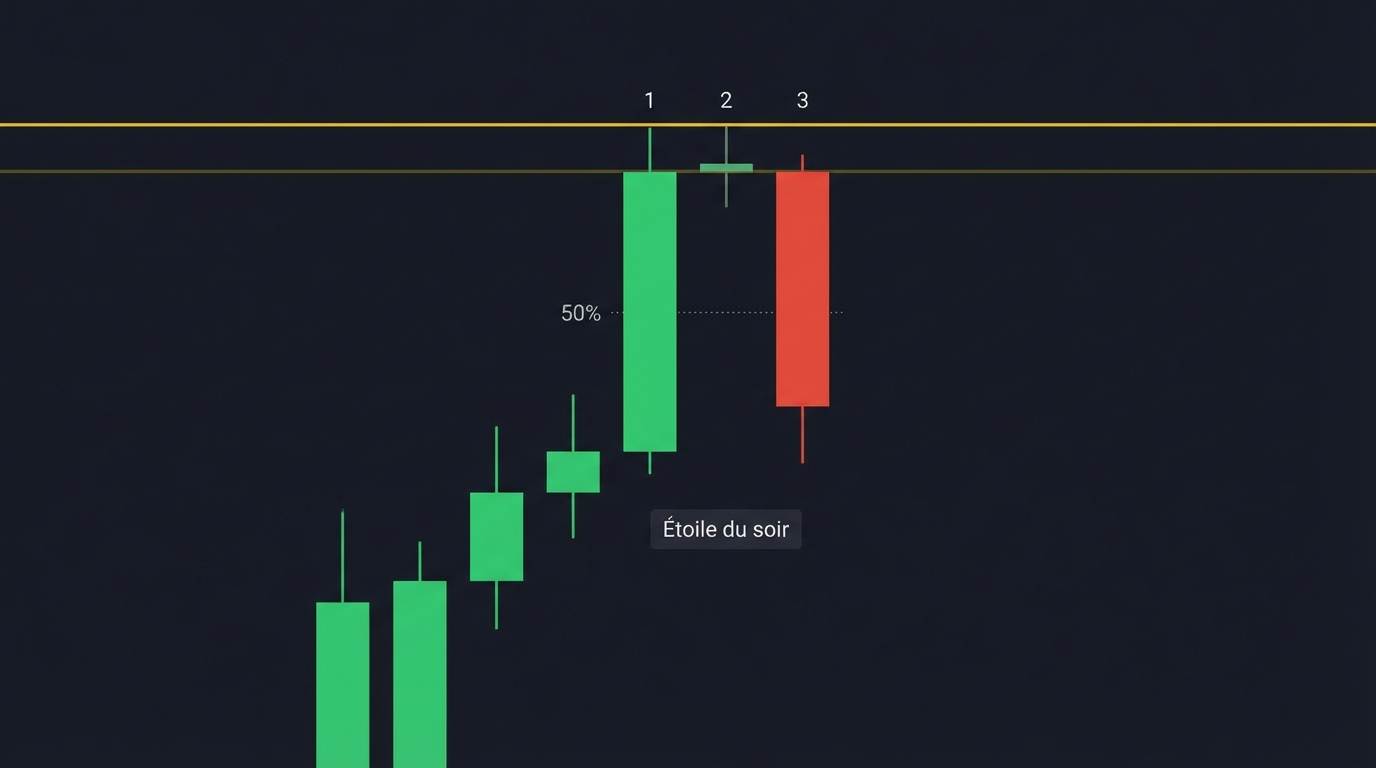
Inverted hammer vs. shooting star
The shooting star looks like the inverted hammer, but it’s the opposite: a long upper wick at the end of an uptrend, not a downtrend.
Inverted hammer: Downtrend → Bullish signal.
Shooting star: Uptrend → Bearish signal.
Context is everything. Both candles can have the same shape, but what makes them useful is where they appear. Don’t confuse the two.
Inverted hammer vs. hammer
The hammer has a long lower wick, not upper. It’s the inverse of the inverted hammer.
Hammer: Long lower wick, small body, tiny upper wick. Bullish signal after a decline.
Inverted hammer: Long upper wick, small body, tiny lower wick. Bullish signal after a decline.
Both patterns are bullish and appear after a drop. The difference? The orientation of the long wick. On a chart, they’re very easy to distinguish visually.
Inverted hammer vs. bullish engulfing
A bullish engulfing is a two-candle pattern: a small bearish candle followed by a large bullish candle that completely engulfs it.
An inverted hammer is a single candle with a specific structure (long upper wick).
The bullish engulfing is often more reliable because it clearly shows the power shifting from sellers to buyers. The inverted hammer is subtler: it shows buyers arriving, but not as clearly that they’re already winning.
The two can coexist, for example if the first candle of the engulfing is the inverted hammer. That’s a rare and very powerful confluence.
Inverted hammer vs. bullish harami
A bullish harami is also two candles: a large bearish candle followed by a small bullish candle entirely within the prior one.
The harami shows a loss of bearish momentum. The inverted hammer shows a buyer counterattack with a long upper wick.
The inverted hammer has more punch because it shows aggressive buyers (the long upper wick). The harami is more passive.
Don’t mix them up. Learn to recognize both and favor patterns with a clear structure, like the inverted hammer when it’s well-formed.
Inverted hammer vs. reversal doji
A reversal doji has identical (or nearly identical) open and close with a long upper wick. It’s almost like a doji inverted hammer.
The difference? The doji shows perfect balance between buyers and sellers. The inverted hammer shows sellers keep a bit of control (the body closes lower).
In reality, they’re two names for very similar patterns. If you trade one, trade the other. The formation is nearly identical.
How to trade the inverted hammer
Method 1: entry on break of the high (classic)
This is the most popular and safest method.
As soon as price breaks the high of the inverted hammer’s upper wick, you enter long. It means buyers have enough strength to exceed the pattern’s top, not just return to the close.
Advantage: the signal is very clear. When price breaks, it’s an automatic confirmation that buyers are in control.
Drawback: you enter a bit late. If the wick’s high is 50 and you enter when price breaks 50, price may already have climbed a little. You give up a small part of the move.
For this method, place your stop loss below the inverted hammer’s low, or slightly below to account for volatility.
Method 2: entry at the confirmation candle close (conservative)
This method waits for the candle after the inverted hammer to close above the pattern’s body.
You enter at the close of this confirmation candle. It’s less aggressive than the break, but more clearly confirmed by the closing price.
Advantage: it’s easy to execute, and you have a true closing confirmation.
Drawback: you enter even later. Price has had more time to move before your entry.
For this method, your stop loss remains below the inverted hammer’s low.
Method 3: entry on pullback after breakout (patient)
This method is for patient traders seeking a better entry price.
First, the inverted hammer appears and forms. You wait for the break of the high. But instead of entering immediately on the break, you wait for a pullback: price comes back down to test the inverted hammer’s high, then rebounds.
You enter at the pullback rebound. It’s your most optimal entry in terms of risk/reward.
Advantage: better entry price, double confirmation (break + pullback), excellent risk/reward ratio.
Drawback: the pullback may not happen. Price can break higher and run without returning. You miss the trade.
For this method, place your stop loss below the pullback low or below the underlying support.
Additional price action triggers
Support rejection
After an inverted hammer, if price tests a support and that support rejects it upward, that’s an additional entry signal. You enter long as soon as price bounces from support.
This rejection shows the support is holding and buyers are actively defending it.
Break and retest
An inverted hammer followed by a break of a minor resistance, then a retest of that resistance, is a classic and reliable entry scenario.
You enter at the retest, when price tests the resistance from above and fails to break down. It’s pure price action structure.
Reversal micro-structure
Observe the micro-structure after the inverted hammer: lows should rise and highs should exceed previous highs. If this structure forms, it’s confirmation of a reversal being built.
You can scale in on each new micro higher high breakout.
Stop loss, take profit, and risk management
Placing the stop loss
Stop below the inverted hammer’s low
This is the simplest and most popular method. Place your stop loss slightly below the inverted hammer’s lower wick low.
“Slightly” means 1–2% below, to account for small wicks that can pierce the level without truly breaking structure.
Advantage: it’s a clear, easy-to-define level. You know exactly where you’re out if you’re wrong.
Drawback: in a volatile market, the stop can get tagged by a simple wick, invalidating your trade without a real reversal.
Stop below the support (if structure)
If the inverted hammer forms exactly at a major horizontal support, you can place your stop below that support, not below the inverted hammer’s low.
Why? Because if the major support breaks, the whole structure is invalidated. You want to be out if that happens.
Advantage: a wider stop based on a real structural factor (support).
Drawback: more risk per trade, since the distance is larger.
Volatility-based stop (ATR)
ATR (Average True Range) measures average volatility. You can place your stop at a distance equal to 1 to 2 times the ATR below the inverted hammer.
In a volatile market (high ATR), your stop is wider. In a calm market (low ATR), your stop is tighter. It’s a smart adaptation.
Advantage: the stop adapts to real market volatility.
Drawback: less intuitive than direct price levels.
Choose the method that suits you. The important thing is that you have a stop loss—period.
Placing the take profit
Resistances and liquidity zones
Identify the next major resistance above your entry. That’s your logical take-profit target. Why? Because price will test that resistance, and many sellers will sell there, capping the move.
Also look for liquidity zones: levels where many traders have positioned. These zones often halt price moves.
Your take profit should be based on market reality, not a random number.
Targets by reward/risk ratio
A simple method: define a 2:1 or 3:1 reward/risk ratio. If you risk 100, target a gain of 200 (2:1) or 300 (3:1).
That means your take profit is set at a distance 2–3 times larger than your stop loss.
For the inverted hammer example:
- Inverted hammer high: 50
- Low (stop loss): 48
- Risk: 2 points
- Entry: 50.2 (breakout)
- Take profit (2:1): 50.2 + (2 x 2) = 54.2
It’s simple, rule-based, and it works.
Partial exits and trailing stop
Instead of a single position, split your position into 2–3 parts:
- First exit: first minor resistance (35% of the position)
- Second exit: second major resistance (35% of the position)
- Third exit: let it run to the final take profit (30% of the position)
This lets you bank gains progressively while keeping a portion for larger moves.
Once you’ve taken the first 35%, place a trailing stop on the remainder to lock in profits.
It’s a sophisticated approach, but it works well in real conditions.
Position sizing
Fixed risk per trade
Decide in advance how much money you risk per trade. For example, 1% of your account balance.
If your account is 10,000, you risk a maximum of 100 per trade. That’s your fixed risk.
Then calculate position size based on the risk:
Size = Risk / Stop loss distance
If you risk 100 and the stop loss is 2 points from your entry, you trade 50 contracts or 5,000 notional, depending on the product.
This method protects your capital over the long run. One losing trade can never blow up your account.
Adjustment by volatility
In a very volatile market (high ATR), reduce your position size. You risk less money because the stop loss is farther away.
In a calm market (low ATR), you can slightly increase size, since the stop loss is closer.
It’s a smart adaptation: you stay within your fixed risk while adjusting to market conditions.
Managing correlations and exposure
Don’t trade the inverted hammer simultaneously on 5 forex pairs or 10 correlated stocks. You’re concentrating risk.
At any time, keep total exposure under 3–5% of the balance. That means if all your trades lose at once (worst-case scenario), you lose a maximum of 5%. That’s manageable.
Diversify markets, timeframes, assets. Never put all your money on a single setup, even if it’s the inverted hammer.
Real-world validation checklist
Quick 10-point checklist
Before opening a position
- There is a clear downtrend before the inverted hammer
- The inverted hammer has a very long upper wick (2–3 times the body minimum)
- The inverted hammer’s body is very small
- The lower wick is almost nonexistent
- The inverted hammer is located at support, a Fibonacci level, or a psychological level
- The candle after the inverted hammer closes above the body or breaks the high
- Volume on the inverted hammer is normal or high
- My stop loss is clearly defined (below the low)
- My take profit targets a minimum 2:1 or 3:1 ratio
- I risk at most 1% of my account on this trade
Simple setup scoring (context, signal, confirmation)
You can score each setup from 0 to 10:
Context (0–3 points): Is there a real downtrend? Is it at an important zone? Zero points if no context, 3 points if context is perfect.
Signal (0–4 points): Is the inverted hammer well-formed? Very long upper wick? Tiny body? Zero if weak, 4 if perfect.
Confirmation (0–3 points): Is there true confirmation by the next candle? High volume? A breakout? Zero if none, 3 if fully confirmed.
A score of 8–10: golden setup—trade normally.
A score of 5–7: acceptable setup—perhaps trade with reduced size.
Below 5: pass—it’s not the right setup.
Common mistakes to avoid
Inverted hammer trading traps
Taking the signal without a prior trend: You see an inverted hammer after a short rise, not a decline. You trade anyway. 70% chance of losing. Wait for a clear downtrend.
Signal in the middle of a range: Price has been bouncing between two levels for a long time. An inverted hammer appears. You trade. Price falls back into the range. It was a trap. Avoid range trading.
No confirmation: You enter on the inverted hammer alone, without waiting for the next candle’s confirmation. You’re wrong; the decline resumes immediately. Always wait for confirmation.
Stop too tight in a volatile market: You place your stop exactly at the inverted hammer’s low with no margin. Price makes a small wick; you get stopped out by market noise, not a real reversal. Adjust your stop to volatility.
Example scenarios to replicate
Example 1: inverted hammer at major support + clear confirmation
The setup
Bitcoin tests the 40,000 support (a level where it bounced 3 times before). A bearish candle forms, then a perfect inverted hammer appears exactly at 40,000. Very long wick up to 42,000, small body closing at 40,500.
Confirmation: The next candle closes green at 41,500, well above the inverted hammer. High volume (above average).
The action: You go long on a break of 42,000 (the inverted hammer high). Stop loss at 39,800. Take profit at 44,000 (about a 2:1 ratio).
The result: Bitcoin rises to 44,500; you exit at take profit. Net gain: +2,500 for a 1,200 risk. Very good ratio.
This is the ideal scenario: downtrend + perfect pattern + major support + clear confirmation.
Example 2: inverted hammer in a range (setup to avoid)
The setup
Renault stock has been trading between 42 and 48 for 3 weeks. No real trend, just back and forth. An inverted hammer appears at 42 (the bottom of the range).
Why it’s bad: There’s no downtrend, just a range. The inverted hammer bounces between 42 and 48—it’s a classic range trap. 65% of range trades lose.
The action: You spot the pattern and ignore it. You wait for a real range breakout (above 48 or below 42).
The result: You don’t trade, you don’t lose. No gain, but no loss either. That’s the right choice.
Lesson: the inverted hammer in a range is a weak signal. Look for a real downtrend first.
Example 3: inverted hammer after capitulation (high volatility)
The setup
A crypto has fallen 50% in one week. Volatility is extreme. An inverted hammer forms with a gigantic upper wick (5 times the body) and a huge gap the next day.
The problem: Volatility is so high that your stop loss needs to be very wide to avoid being hit. If you normally risk 2%, you’d need to risk 5–6% on this trade. That’s too much.
The action: You cut your position size by 50%. Or you wait for volatility to drop before trading the pattern.
The result: You trade with less risk exposure. If you win, the gain is smaller. If you lose, the loss is smaller too. It’s a good compromise.
Lesson: adjust your size to volatility, not the other way around.
Example 4: inverted hammer followed by pullback (optimized entry)
The setup
The CAC 40 tests 6,400 (support). An inverted hammer forms. The high is 6,450. You wait for the break above 6,450, and it comes. But then price returns to test 6,450 before rising again.
The action: Instead of entering on the break (6,450+), you wait for the pullback. Price dips to 6,445, then rebounds. You enter at 6,448 when price clearly bounces.
Advantage: Better entry price (6,448 instead of 6,455), double confirmation (break + pullback), stop loss below the pullback at 6,440.
The result: The CAC rises to 6,500. You gain 52 points for an 8-point risk. 6.5:1 ratio. Excellent.
Lesson: don’t rush. The pullback gives you a better entry and more safety.
Frequently asked questions about the inverted hammer
Does the inverted hammer work on all timeframes?
Yes, the inverted hammer works on all timeframes, with nuances.
On very short timeframes (1M, 5M), the pattern is noisier. Random market moves create many false signals. Your win rate is around 40–45%.
On standard timeframes (15M, 1H, 4H, Daily), the inverted hammer works better. Win rate around 55–65%, depending on confluence and confirmation.
On very long timeframes (Weekly, Monthly), patterns are rarer, but when they appear, they’re very reliable. Win rate 60–70%.
Tip: start on the Daily or 4H. It’s a good balance between clarity and trade frequency.
Do you need a green candle to validate the pattern?
No, not necessarily. A red (bearish) inverted hammer can also work if the overall context is good.
However, a green inverted hammer is more reliable than a red one. Green shows buyers are clearly winning. Red slightly dilutes the signal.
In practice: if your inverted hammer is red, demand clearer confirmation from the next candle before trading. If it’s green, you can be a bit less demanding.
Never reject a setup just because the inverted hammer is red. Assess the full context.
What is the most reliable confirmation?
In order of reliability:
1st: Break of the high + high volume. The most reliable. Price clearly breaks; volume confirms traders are acting. 70%+ success.
2nd: Next candle closes above the body. Also reliable, but slightly less than the break. 65%+ success.
3rd: Bullish divergence + inverted hammer. Very reliable, but rarer. When both coexist, win rate exceeds 75%.
4th: Sequence change (higher low). Reliable long term, but takes time to appear. 60–65%.
Favor the first two confirmations. They’re fast and clear.
What exactly is the difference with the shooting star?
The shooting star and the inverted hammer are mirror images.
Shooting star: long upper wick at the end of an uptrend. Bearish signal.
Inverted hammer: long upper wick at the end of a downtrend. Bullish signal.
The candle can have exactly the same shape. The difference is context. Inverted hammer = prior decline, bullish signal. Shooting star = prior rise, bearish signal.
Lesson: always look at the prior trend to know which pattern you’re dealing with.
Can you trade the pattern without indicators?
Absolutely. The inverted hammer is a pure price action pattern. You need only price, not indicators.
Look for:
- Prior downtrend
- Well-formed inverted hammer
- Support, Fibonacci, or psychological level below
- Confirmation by the next candle
That’s enough. Indicators (RSI, MACD, Bollinger Bands) help, but they’re just add-ons.
Many pro traders trade the inverted hammer with no indicators at all. They just look at price, supports, resistances, and patterns.
Conclusion
The inverted hammer is one of the most reliable Japanese candlestick patterns for identifying a bullish reversal after a downtrend. When this candle appears with a long upper wick and a small body, it tells a clear story: buyers are arriving, even if sellers still retain a bit of control.
To trade the inverted hammer successfully, you need three things: a prior bearish context, an important price location (support, Fibonacci, psychological level), and clear confirmation from the next candle. Without these three elements, the signal weakens drastically.
The pattern works across markets (stocks, crypto, forex) and all timeframes from 15M to Daily. Three entry methods exist: break of the high, confirmation close, or pullback after breakout. Each has its advantages. Choose the one that fits your trading style.
Risk management remains your best asset: always place your stop below the inverted hammer, target a 2:1 or 3:1 ratio, and never risk more than 1% of your account per trade. The inverted hammer won’t make you rich overnight, but used regularly with discipline, it will solidly contribute to your real-world trading.
Start on the Daily or 4H timeframe to learn. Once you master the pattern there, you can adapt it to other markets and conditions. It’s a powerful, simple-to-use tool that has proven itself for decades in candlestick trading.